Mean orientation per grain
In this notebook, we wiil see how to performed average orientation per grain.
import xarrayaita.loadData_aita as lda #here are some function to build xarrayaita structure
import xarrayaita.aita as xa
import xarrayuvecs.uvecs as xu
import xarrayuvecs.lut2d as lut2d

import matplotlib.pyplot as plt
import matplotlib.cm as cm
import numpy as np
import scipy
Load your data
# path to data and microstructure
path_data='orientation_test.dat'
path_micro='micro_test.bmp'
data=lda.aita5col(path_data,path_micro)
data
<xarray.Dataset>
Dimensions:      (uvecs: 2, x: 1000, y: 2500)
Coordinates:
  * x            (x) float64 0.0 0.02 0.04 0.06 0.08 ... 19.92 19.94 19.96 19.98
  * y            (y) float64 49.98 49.96 49.94 49.92 49.9 ... 0.06 0.04 0.02 0.0
Dimensions without coordinates: uvecs
Data variables:
    orientation  (y, x, uvecs) float64 2.395 0.6451 5.377 ... 0.6098 0.6473
    quality      (y, x) int64 0 90 92 93 92 92 94 94 ... 96 96 96 96 96 97 97 96
    micro        (y, x) float64 0.0 0.0 0.0 0.0 0.0 0.0 ... 0.0 0.0 0.0 0.0 0.0
    grainId      (y, x) int64 1 1 1 1 1 1 1 1 1 1 1 1 ... 1 1 1 1 1 1 1 1 1 1 1
Attributes:
    date:       Thursday, 19 Nov 2015, 11:24 am
    unit:       millimeters
    step_size:  0.02
    path_dat:   orientation_test.dat
xarray.Dataset
- uvecs: 2
- x: 1000
- y: 2500
- x(x)float640.0 0.02 0.04 ... 19.94 19.96 19.98
array([ 0. , 0.02, 0.04, ..., 19.94, 19.96, 19.98])
- y(y)float6449.98 49.96 49.94 ... 0.04 0.02 0.0
array([4.998e+01, 4.996e+01, 4.994e+01, ..., 4.000e-02, 2.000e-02, 0.000e+00])
- orientation(y, x, uvecs)float642.395 0.6451 ... 0.6098 0.6473
array([[[2.39476627, 0.64507369], [5.37718489, 1.04999008], [5.38905313, 1.05627326], ..., [2.05826679, 0.49654617], [5.65731024, 0.94160513], [5.68523551, 1.03218772]], [[5.35955707, 1.15837502], [5.35885894, 1.12975162], [5.3613024 , 1.11701072], ..., [2.07659274, 0.52063172], [5.64753639, 0.94073247], [5.67912685, 1.04143796]], [[5.36304773, 1.23045712], [5.36165146, 1.23132979], [2.38656322, 0.57246799], ..., ... ..., [0.62378067, 0.625526 ], [0.61784656, 0.61994095], [0.61645029, 0.61400683]], [[0.68085294, 1.12399204], [0.68050388, 1.12730816], [0.67840948, 1.13900187], ..., [0.64123397, 0.62954026], [0.62430427, 0.63529985], [0.61575216, 0.62203535]], [[0.67701322, 1.13236962], [0.67753682, 1.13690747], [0.67840948, 1.13149695], ..., [0.63652158, 0.61418136], [0.61645029, 0.63948864], [0.60981804, 0.64734262]]]) - quality(y, x)int640 90 92 93 92 92 ... 96 96 97 97 96
array([[ 0, 90, 92, ..., 0, 85, 90], [81, 82, 83, ..., 0, 84, 89], [81, 80, 3, ..., 0, 79, 88], ..., [90, 91, 91, ..., 95, 95, 95], [91, 92, 91, ..., 95, 95, 95], [92, 92, 91, ..., 97, 97, 96]]) - micro(y, x)float640.0 0.0 0.0 0.0 ... 0.0 0.0 0.0 0.0
array([[0., 0., 0., ..., 0., 0., 0.], [0., 0., 0., ..., 0., 0., 0.], [0., 0., 0., ..., 0., 0., 0.], ..., [0., 0., 0., ..., 0., 0., 0.], [0., 0., 0., ..., 0., 0., 0.], [0., 0., 0., ..., 0., 0., 0.]]) - grainId(y, x)int641 1 1 1 1 1 1 1 ... 1 1 1 1 1 1 1 1
array([[1, 1, 1, ..., 1, 1, 1],
       [1, 1, 1, ..., 1, 1, 1],
       [1, 1, 1, ..., 1, 1, 1],
       ...,
       [1, 1, 1, ..., 1, 1, 1],
       [1, 1, 1, ..., 1, 1, 1],
       [1, 1, 1, ..., 1, 1, 1]])
- date :
- Thursday, 19 Nov 2015, 11:24 am
- unit :
- millimeters
- step_size :
- 0.02
- path_dat :
- orientation_test.dat
Filter the data
data.aita.filter(75)
The average orientation
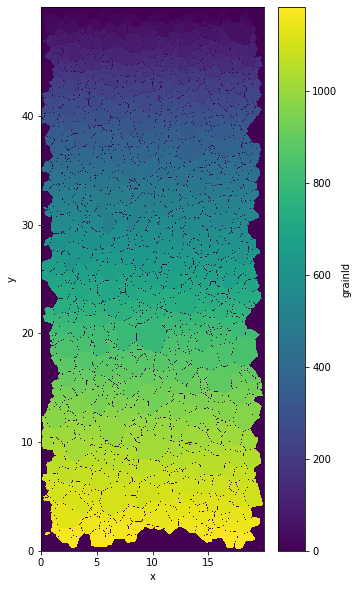
The definition of the grain is base on the value present in grainId variable. Therefore one grain corresponds to all the pixel with the same label.
plt.figure(figsize=(5,10))
data.grainId.plot()
<matplotlib.collections.QuadMesh at 0x7effc6e2dd90>
The “average” orientation is defined as the main eigen vectoc of the seconde order orientation tensor (see uvecs.OT2nd). And can be compute with aita.mean_grain.
help(xa.aita.mean_grain)
Help on function mean_grain in module xarrayaita.aita:

mean_grain(self, dilate=True)
    Compute the mean orientation inside the grain
    :param dilate: remove grain boundaries by dilatation (default True)
    :type dilate: bool
data['orientation_mg']=data.aita.mean_grain()
The output
data
<xarray.Dataset>
Dimensions:         (uvecs: 2, x: 1000, y: 2500)
Coordinates:
  * x               (x) float64 0.0 0.02 0.04 0.06 ... 19.92 19.94 19.96 19.98
  * y               (y) float64 49.98 49.96 49.94 49.92 ... 0.06 0.04 0.02 0.0
Dimensions without coordinates: uvecs
Data variables:
    orientation     (y, x, uvecs) float64 nan nan 5.377 ... 0.6395 0.6098 0.6473
    quality         (y, x) int64 0 90 92 93 92 92 94 94 ... 96 96 96 96 97 97 96
    micro           (y, x) float64 0.0 0.0 0.0 0.0 0.0 ... 0.0 0.0 0.0 0.0 0.0
    grainId         (y, x) int64 1 1 1 1 1 1 1 1 1 1 1 ... 1 1 1 1 1 1 1 1 1 1 1
    orientation_mg  (y, x, uvecs) float64 -0.662 0.884 -0.662 ... -0.662 0.884
Attributes:
    date:       Thursday, 19 Nov 2015, 11:24 am
    unit:       millimeters
    step_size:  0.02
    path_dat:   orientation_test.dat
xarray.Dataset
- uvecs: 2
- x: 1000
- y: 2500
- x(x)float640.0 0.02 0.04 ... 19.94 19.96 19.98
array([ 0. , 0.02, 0.04, ..., 19.94, 19.96, 19.98])
- y(y)float6449.98 49.96 49.94 ... 0.04 0.02 0.0
array([4.998e+01, 4.996e+01, 4.994e+01, ..., 4.000e-02, 2.000e-02, 0.000e+00])
- orientation(y, x, uvecs)float64nan nan 5.377 ... 0.6098 0.6473
array([[[ nan, nan], [5.37718489, 1.04999008], [5.38905313, 1.05627326], ..., [ nan, nan], [5.65731024, 0.94160513], [5.68523551, 1.03218772]], [[5.35955707, 1.15837502], [5.35885894, 1.12975162], [5.3613024 , 1.11701072], ..., [ nan, nan], [5.64753639, 0.94073247], [5.67912685, 1.04143796]], [[5.36304773, 1.23045712], [5.36165146, 1.23132979], [ nan, nan], ..., ... ..., [0.62378067, 0.625526 ], [0.61784656, 0.61994095], [0.61645029, 0.61400683]], [[0.68085294, 1.12399204], [0.68050388, 1.12730816], [0.67840948, 1.13900187], ..., [0.64123397, 0.62954026], [0.62430427, 0.63529985], [0.61575216, 0.62203535]], [[0.67701322, 1.13236962], [0.67753682, 1.13690747], [0.67840948, 1.13149695], ..., [0.63652158, 0.61418136], [0.61645029, 0.63948864], [0.60981804, 0.64734262]]]) - quality(y, x)int640 90 92 93 92 92 ... 96 96 97 97 96
array([[ 0, 90, 92, ..., 0, 85, 90], [81, 82, 83, ..., 0, 84, 89], [81, 80, 3, ..., 0, 79, 88], ..., [90, 91, 91, ..., 95, 95, 95], [91, 92, 91, ..., 95, 95, 95], [92, 92, 91, ..., 97, 97, 96]]) - micro(y, x)float640.0 0.0 0.0 0.0 ... 0.0 0.0 0.0 0.0
array([[0., 0., 0., ..., 0., 0., 0.], [0., 0., 0., ..., 0., 0., 0.], [0., 0., 0., ..., 0., 0., 0.], ..., [0., 0., 0., ..., 0., 0., 0.], [0., 0., 0., ..., 0., 0., 0.], [0., 0., 0., ..., 0., 0., 0.]]) - grainId(y, x)int641 1 1 1 1 1 1 1 ... 1 1 1 1 1 1 1 1
array([[1, 1, 1, ..., 1, 1, 1], [1, 1, 1, ..., 1, 1, 1], [1, 1, 1, ..., 1, 1, 1], ..., [1, 1, 1, ..., 1, 1, 1], [1, 1, 1, ..., 1, 1, 1], [1, 1, 1, ..., 1, 1, 1]]) - orientation_mg(y, x, uvecs)float64-0.662 0.884 ... -0.662 0.884
array([[[-0.66201007,  0.88398576],
        [-0.66201007,  0.88398576],
        [-0.66201007,  0.88398576],
        ...,
        [-0.66201007,  0.88398576],
        [-0.66201007,  0.88398576],
        [-0.66201007,  0.88398576]],

       [[-0.66201007,  0.88398576],
        [-0.66201007,  0.88398576],
        [-0.66201007,  0.88398576],
        ...,
        [-0.66201007,  0.88398576],
        [-0.66201007,  0.88398576],
        [-0.66201007,  0.88398576]],

       [[-0.66201007,  0.88398576],
        [-0.66201007,  0.88398576],
        [-0.66201007,  0.88398576],
        ...,
...
        ...,
        [-0.66201007,  0.88398576],
        [-0.66201007,  0.88398576],
        [-0.66201007,  0.88398576]],

       [[-0.66201007,  0.88398576],
        [-0.66201007,  0.88398576],
        [-0.66201007,  0.88398576],
        ...,
        [-0.66201007,  0.88398576],
        [-0.66201007,  0.88398576],
        [-0.66201007,  0.88398576]],

       [[-0.66201007,  0.88398576],
        [-0.66201007,  0.88398576],
        [-0.66201007,  0.88398576],
        ...,
        [-0.66201007,  0.88398576],
        [-0.66201007,  0.88398576],
        [-0.66201007,  0.88398576]]])
- date :
- Thursday, 19 Nov 2015, 11:24 am
- unit :
- millimeters
- step_size :
- 0.02
- path_dat :
- orientation_test.dat
data.orientation_mg is an orientation xarray.DataArray that have the same properties than the original orientation. Therefore all uvecs function can be use safely on this xarray.DataArray.
Plot colormap
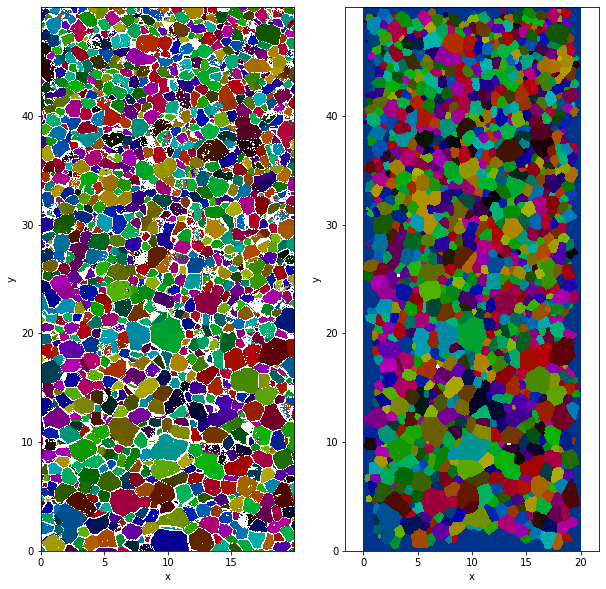
You can compute colormap for both orientation and orientation_mg
data['f_map']=data.orientation.uvecs.calc_colormap()
data['f_map_mg']=data.orientation_mg.uvecs.calc_colormap()
plt.figure(figsize=(10,10))
plt.subplot(121)
data.f_map.plot.imshow()
plt.subplot(122)
data.f_map_mg.plot.imshow()
plt.axis('equal')
Clipping input data to the valid range for imshow with RGB data ([0..1] for floats or [0..255] for integers).
Clipping input data to the valid range for imshow with RGB data ([0..1] for floats or [0..255] for integers).
(-0.01, 19.990000000000002, -0.010000000000001563, 49.99000000000001)