The misorientation angle distribution
Definition
The misorientation angle distribution is the PDF of the all the misorientation angle. Four misorientations angles are defined for each pixel, one for each neighboors.
import xarrayaita.loadData_aita as lda #here are some function to build xarrayaita structure
import xarrayaita.aita as xa
import xarrayuvecs.uvecs as xu
import xarrayuvecs.lut2d as lut2d

import matplotlib.pyplot as plt
import matplotlib.cm as cm
import numpy as np
import scipy
Load your data
# path to data and microstructure
path_data='orientation_test.dat'
path_micro='micro_test.bmp'
data=lda.aita5col(path_data,path_micro)
data
<xarray.Dataset>
Dimensions:      (uvecs: 2, x: 1000, y: 2500)
Coordinates:
  * x            (x) float64 0.0 0.02 0.04 0.06 0.08 ... 19.92 19.94 19.96 19.98
  * y            (y) float64 49.98 49.96 49.94 49.92 49.9 ... 0.06 0.04 0.02 0.0
Dimensions without coordinates: uvecs
Data variables:
    orientation  (y, x, uvecs) float64 2.395 0.6451 5.377 ... 0.6098 0.6473
    quality      (y, x) int64 0 90 92 93 92 92 94 94 ... 96 96 96 96 96 97 97 96
    micro        (y, x) float64 0.0 0.0 0.0 0.0 0.0 0.0 ... 0.0 0.0 0.0 0.0 0.0
    grainId      (y, x) int64 1 1 1 1 1 1 1 1 1 1 1 1 ... 1 1 1 1 1 1 1 1 1 1 1
Attributes:
    date:       Thursday, 19 Nov 2015, 11:24 am
    unit:       millimeters
    step_size:  0.02
path_dat: orientation_test.dat- uvecs: 2
- x: 1000
- y: 2500
- x(x)float640.0 0.02 0.04 ... 19.94 19.96 19.98
array([ 0. , 0.02, 0.04, ..., 19.94, 19.96, 19.98])
- y(y)float6449.98 49.96 49.94 ... 0.04 0.02 0.0
array([4.998e+01, 4.996e+01, 4.994e+01, ..., 4.000e-02, 2.000e-02, 0.000e+00])
- orientation(y, x, uvecs)float642.395 0.6451 ... 0.6098 0.6473
array([[[2.39476627, 0.64507369], [5.37718489, 1.04999008], [5.38905313, 1.05627326], ..., [2.05826679, 0.49654617], [5.65731024, 0.94160513], [5.68523551, 1.03218772]], [[5.35955707, 1.15837502], [5.35885894, 1.12975162], [5.3613024 , 1.11701072], ..., [2.07659274, 0.52063172], [5.64753639, 0.94073247], [5.67912685, 1.04143796]], [[5.36304773, 1.23045712], [5.36165146, 1.23132979], [2.38656322, 0.57246799], ..., ... ..., [0.62378067, 0.625526 ], [0.61784656, 0.61994095], [0.61645029, 0.61400683]], [[0.68085294, 1.12399204], [0.68050388, 1.12730816], [0.67840948, 1.13900187], ..., [0.64123397, 0.62954026], [0.62430427, 0.63529985], [0.61575216, 0.62203535]], [[0.67701322, 1.13236962], [0.67753682, 1.13690747], [0.67840948, 1.13149695], ..., [0.63652158, 0.61418136], [0.61645029, 0.63948864], [0.60981804, 0.64734262]]]) - quality(y, x)int640 90 92 93 92 92 ... 96 96 97 97 96
array([[ 0, 90, 92, ..., 0, 85, 90], [81, 82, 83, ..., 0, 84, 89], [81, 80, 3, ..., 0, 79, 88], ..., [90, 91, 91, ..., 95, 95, 95], [91, 92, 91, ..., 95, 95, 95], [92, 92, 91, ..., 97, 97, 96]]) - micro(y, x)float640.0 0.0 0.0 0.0 ... 0.0 0.0 0.0 0.0
array([[0., 0., 0., ..., 0., 0., 0.], [0., 0., 0., ..., 0., 0., 0.], [0., 0., 0., ..., 0., 0., 0.], ..., [0., 0., 0., ..., 0., 0., 0.], [0., 0., 0., ..., 0., 0., 0.], [0., 0., 0., ..., 0., 0., 0.]]) - grainId(y, x)int641 1 1 1 1 1 1 1 ... 1 1 1 1 1 1 1 1
array([[1, 1, 1, ..., 1, 1, 1],
       [1, 1, 1, ..., 1, 1, 1],
       [1, 1, 1, ..., 1, 1, 1],
       ...,
       [1, 1, 1, ..., 1, 1, 1],
       [1, 1, 1, ..., 1, 1, 1],
       [1, 1, 1, ..., 1, 1, 1]])
- date :
- Thursday, 19 Nov 2015, 11:24 am
- unit :
- millimeters
- step_size :
- 0.02
- path_dat :
- orientation_test.dat
Filter the data
data.aita.filter(75)
Performed xa.aita.mean_grain
Depending of your application you can performed xa.aita.mean_grain.
data['orientation_mg']=data.aita.mean_grain()
Compute mis-orientation angle
Compute ordered mis-orientation
data['misod_mg']=data.orientation_mg.uvecs.mis_angle()
/home/chauvet/miniconda3/envs/basepy38/lib/python3.8/site-packages/xarray/core/computation.py:724: RuntimeWarning: invalid value encountered in remainder
  result_data = func(*input_data)
The strucure of the xarray.DataArray output
data
<xarray.Dataset>
Dimensions:         (misAngle: 4, uvecs: 2, x: 1000, y: 2500)
Coordinates:
  * x               (x) float64 0.0 0.02 0.04 0.06 ... 19.92 19.94 19.96 19.98
  * y               (y) float64 49.98 49.96 49.94 49.92 ... 0.06 0.04 0.02 0.0
Dimensions without coordinates: misAngle, uvecs
Data variables:
    orientation     (y, x, uvecs) float64 nan nan 5.377 ... 0.6395 0.6098 0.6473
    quality         (y, x) int64 0 90 92 93 92 92 94 94 ... 96 96 96 96 97 97 96
    micro           (y, x) float64 0.0 0.0 0.0 0.0 0.0 ... 0.0 0.0 0.0 0.0 0.0
    grainId         (y, x) int64 1 1 1 1 1 1 1 1 1 1 1 ... 1 1 1 1 1 1 1 1 1 1 1
    orientation_mg  (y, x, uvecs) float64 -0.662 0.884 -0.662 ... -0.662 0.884
    misod_mg        (y, x, misAngle) float64 nan nan nan nan ... nan nan nan nan
Attributes:
    date:       Thursday, 19 Nov 2015, 11:24 am
    unit:       millimeters
    step_size:  0.02
path_dat: orientation_test.dat- misAngle: 4
- uvecs: 2
- x: 1000
- y: 2500
- x(x)float640.0 0.02 0.04 ... 19.94 19.96 19.98
array([ 0. , 0.02, 0.04, ..., 19.94, 19.96, 19.98])
- y(y)float6449.98 49.96 49.94 ... 0.04 0.02 0.0
array([4.998e+01, 4.996e+01, 4.994e+01, ..., 4.000e-02, 2.000e-02, 0.000e+00])
- orientation(y, x, uvecs)float64nan nan 5.377 ... 0.6098 0.6473
array([[[ nan, nan], [5.37718489, 1.04999008], [5.38905313, 1.05627326], ..., [ nan, nan], [5.65731024, 0.94160513], [5.68523551, 1.03218772]], [[5.35955707, 1.15837502], [5.35885894, 1.12975162], [5.3613024 , 1.11701072], ..., [ nan, nan], [5.64753639, 0.94073247], [5.67912685, 1.04143796]], [[5.36304773, 1.23045712], [5.36165146, 1.23132979], [ nan, nan], ..., ... ..., [0.62378067, 0.625526 ], [0.61784656, 0.61994095], [0.61645029, 0.61400683]], [[0.68085294, 1.12399204], [0.68050388, 1.12730816], [0.67840948, 1.13900187], ..., [0.64123397, 0.62954026], [0.62430427, 0.63529985], [0.61575216, 0.62203535]], [[0.67701322, 1.13236962], [0.67753682, 1.13690747], [0.67840948, 1.13149695], ..., [0.63652158, 0.61418136], [0.61645029, 0.63948864], [0.60981804, 0.64734262]]]) - quality(y, x)int640 90 92 93 92 92 ... 96 96 97 97 96
array([[ 0, 90, 92, ..., 0, 85, 90], [81, 82, 83, ..., 0, 84, 89], [81, 80, 3, ..., 0, 79, 88], ..., [90, 91, 91, ..., 95, 95, 95], [91, 92, 91, ..., 95, 95, 95], [92, 92, 91, ..., 97, 97, 96]]) - micro(y, x)float640.0 0.0 0.0 0.0 ... 0.0 0.0 0.0 0.0
array([[0., 0., 0., ..., 0., 0., 0.], [0., 0., 0., ..., 0., 0., 0.], [0., 0., 0., ..., 0., 0., 0.], ..., [0., 0., 0., ..., 0., 0., 0.], [0., 0., 0., ..., 0., 0., 0.], [0., 0., 0., ..., 0., 0., 0.]]) - grainId(y, x)int641 1 1 1 1 1 1 1 ... 1 1 1 1 1 1 1 1
array([[1, 1, 1, ..., 1, 1, 1], [1, 1, 1, ..., 1, 1, 1], [1, 1, 1, ..., 1, 1, 1], ..., [1, 1, 1, ..., 1, 1, 1], [1, 1, 1, ..., 1, 1, 1], [1, 1, 1, ..., 1, 1, 1]]) - orientation_mg(y, x, uvecs)float64-0.662 0.884 ... -0.662 0.884
array([[[-0.66201007, 0.88398576], [-0.66201007, 0.88398576], [-0.66201007, 0.88398576], ..., [-0.66201007, 0.88398576], [-0.66201007, 0.88398576], [-0.66201007, 0.88398576]], [[-0.66201007, 0.88398576], [-0.66201007, 0.88398576], [-0.66201007, 0.88398576], ..., [-0.66201007, 0.88398576], [-0.66201007, 0.88398576], [-0.66201007, 0.88398576]], [[-0.66201007, 0.88398576], [-0.66201007, 0.88398576], [-0.66201007, 0.88398576], ..., ... ..., [-0.66201007, 0.88398576], [-0.66201007, 0.88398576], [-0.66201007, 0.88398576]], [[-0.66201007, 0.88398576], [-0.66201007, 0.88398576], [-0.66201007, 0.88398576], ..., [-0.66201007, 0.88398576], [-0.66201007, 0.88398576], [-0.66201007, 0.88398576]], [[-0.66201007, 0.88398576], [-0.66201007, 0.88398576], [-0.66201007, 0.88398576], ..., [-0.66201007, 0.88398576], [-0.66201007, 0.88398576], [-0.66201007, 0.88398576]]]) - misod_mg(y, x, misAngle)float64nan nan nan nan ... nan nan nan nan
array([[[nan, nan, nan, nan],
        [nan, nan, nan, nan],
        [nan, nan, nan, nan],
        ...,
        [nan, nan, nan, nan],
        [nan, nan, nan, nan],
        [nan, nan, nan, nan]],

       [[nan, nan, nan, nan],
        [ 0.,  0.,  0.,  0.],
        [ 0.,  0.,  0.,  0.],
        ...,
        [ 0.,  0.,  0.,  0.],
        [ 0.,  0.,  0.,  0.],
        [nan, nan, nan, nan]],

       [[nan, nan, nan, nan],
        [ 0.,  0.,  0.,  0.],
        [ 0.,  0.,  0.,  0.],
        ...,
...
        ...,
        [ 0.,  0.,  0.,  0.],
        [ 0.,  0.,  0.,  0.],
        [nan, nan, nan, nan]],

       [[nan, nan, nan, nan],
        [ 0.,  0.,  0.,  0.],
        [ 0.,  0.,  0.,  0.],
        ...,
        [ 0.,  0.,  0.,  0.],
        [ 0.,  0.,  0.,  0.],
        [nan, nan, nan, nan]],

       [[nan, nan, nan, nan],
        [nan, nan, nan, nan],
        [nan, nan, nan, nan],
        ...,
        [nan, nan, nan, nan],
        [nan, nan, nan, nan],
        [nan, nan, nan, nan]]])
- date :
- Thursday, 19 Nov 2015, 11:24 am
- unit :
- millimeters
- step_size :
- 0.02
- path_dat :
- orientation_test.dat
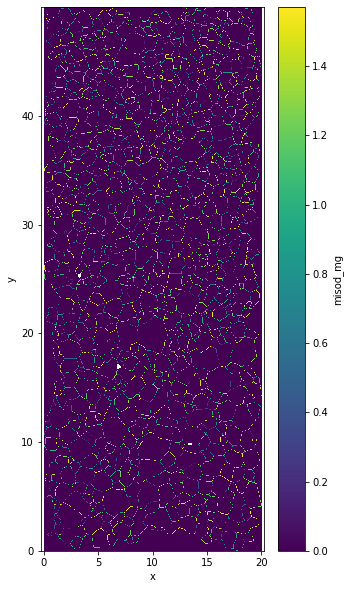
data.misod_mg as 4 layers one for each neighboor.
data.misod_mg[:,:,0]for the top onedata.misod_mg[:,:,1]for the left onedata.misod_mg[:,:,2]for the right onedata.misod_mg[:,:,3]for the bottom one
You can plot the maxium for each pixel if you want to.
plt.figure(figsize=(5,10))
data.misod_mg.max(axis=2).plot.imshow()
plt.axis('equal')
(-0.01, 19.990000000000002, -0.010000000000001563, 49.99000000000001)
Random misorientation distribution
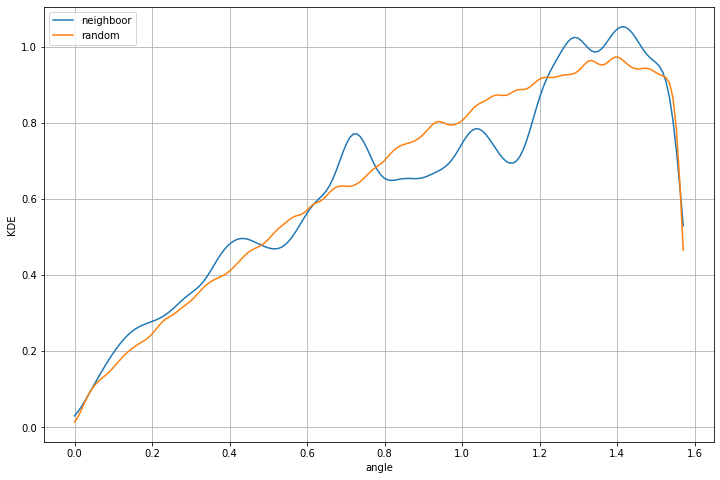
It is importante to compare the distribution with the random distribution. A strong texture can already have a strong impact on random distribution therefore you should always compare your distribtion with the random one.
random_misod=data.orientation_mg.uvecs.mis_angle(random=True)
/home/chauvet/miniconda3/envs/basepy38/lib/python3.8/site-packages/xarray/core/computation.py:724: RuntimeWarning: invalid value encountered in remainder
  result_data = func(*input_data)
Plot misorientation profile
You can filter the small angle value if you want
lim = 1 #degre
Calcul KDE for neighboor results.
angle=np.array(data.misod_mg).flatten()
angle = angle[~np.isnan(angle)]
angle = angle[np.where(angle>lim*np.pi/180)]

kernel_a = scipy.stats.gaussian_kde(angle)
xeval_a=np.linspace(0,np.pi/2,180)
yeval_a=kernel_a(xeval_a)
Calcul KDE for random results.
rangle=random_misod[random_misod>lim*np.pi/180]
kernel_ra = scipy.stats.gaussian_kde(rangle)
xeval_ra=np.linspace(0,np.pi/2,180)
yeval_ra=kernel_ra(xeval_ra)
Plot both distribution
plt.figure(figsize=(12,8))
plt.plot(xeval_a,yeval_a,label='neighboor')
plt.plot(xeval_ra,yeval_ra,label='random')
plt.legend()
plt.grid()
plt.xlabel('angle')
plt.ylabel('KDE')
Text(0, 0.5, 'KDE')